Tag: prometheus

Learning – Prometheus Exporter

Learning - Prometheus Exporter

Steps to monitor MongoDB metrics

  • Deploy MongoDB App
  • Deploy MongoDB Exporter
  • Deploy ServiceMonitor

Deployment

minikube start --cpus 4 --memory 8192 --vm-driver hyperkit
helm ls
kubectl get pod
kubectl get svc
kubectl port-forward prometheus-kube-prometheus-prometheus 9090
kubectl port-forward prometheus-grafana 80

servicemonitor

ServiceMonitor is a custom Kubernetes component

kubectl get servicemonitor
kubectl get servicemonitor prometheus-kube-prometheus-grafana -oyaml
...
metadata:
  labels:
    release: prometheus

spec:
  endpoints:
    - path: /metrics
      port: service
  selector:
    matchLabels:
      app.kubernetes.io/instance: prometheus
      app.kubernetes.io/name: grafana

CRD configuration

$ kubectl get crd
...
prometheuses.monitoring.coreos.com ...
...
$ kubectl get prometheuses.monitoring.coreos.com -oyaml
...
spec:
  serviceMonitorSelector:
    matchLabels:
      release: prometheus
...

Deploy MongoDB

mongodb-without-exporter.yaml

apiVersion: apps/v1
kind: Deployment
metadata:
  name: mongodb-deployment
  labels:
    app: mongodb
spec:
  replicas: 1
  selector:
    matchLabels:
      app: mongodb
  template:
    metadata:
      labels:
        app: mongodb
    spec:
      containers:
      - name: mongodb
        image: mongo
        ports:
        - containerPort: 27017
---
apiVersion: v1
kind: Service
metadata:
  name: mongodb-service
spec:
  selector:
    app: mongodb
  ports:
    - protocol: TCP
      port: 27017
      targetPort: 27017
kubectl apply -f mongodb-without-exporter.yaml
kubectl get pod

Deploy MongoDB Exporter

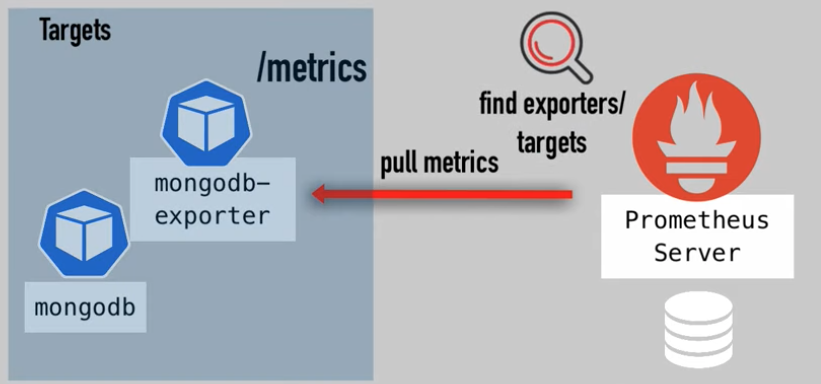
Translator between apps data to Prometheus understandable metrics

Target (MongoDB App) <= fetches metrics <= converts to correct format <= expose /metrics <= Prometheus Server

  • Separate deployment - No need to change config files

MongoDB exporter (mongodb-exporter) can be downloaded from exporter site or dockerhub.

Exporter Site

Exporters can be downloaded from https://prometheus.io/docs/instrumenting/exporters

Nodes exporter - translates metrics of cluster Nodes, exposes /metrics

prometheus-prometheus-node-exporter-8qvwn

Components for exporter

  • Exporter application - exposes /metrics endpoint
  • Service - for connnecting to the exporter
  • ServiceMonitor - to be discovered

Helm chart for exporter

Search for mongodb-exporter helm chart

https://github.com/prometheus-community/helm-charts

Override values using chart parameters

helm show values <chart-name>

Add Helm repo

helm repo add prometheus-community https://prometheus-community.github.io/helm-charts
helm show values prometheus-community/prometheus-mongodb-exporter > values.yaml

Override values in values.yaml

mongodb:
  uri: "mongodb://mongodb-service:27017"

serviceMonitor:
  additionalLabels:
    release: prometheus

with the label Prometheus automatically discovers a new ServiceMonitor in the cluster

$ helm install mongodb-exporter prometheus-community/prometheus-mongodb-exporter -f values.yaml
...
$ helm ls
mongodb-exporter
...
$ kubectl get pod
...
mongodb-exporter-prometheus-mongodb-exporter-75...
...
$ kubectl get svc
...
mongodb-exporter-prometheus-mongodb-exporter
...
$ kubectl get servicemonitor
...
mongodb-exporter-prometheus-mongodb-exporter
...
$ kubectl get servicemonitor mongodb-exporter-prometheus-mongodb-exporter -o yaml
...
metadata:
  labels:
    release: prometheus
...

Check endpoint /metrics

$ kubectl get svc
...
mongodb-exporter-prometheus-mongodb-exporter
...
kubectl port-forward service/mongodb-exporter-prometheus-mongodb-exporter 9216

Access https://127.0.0.1:9216/metrics

The mongodb-exporter is added as targets in prometheus, because the label release: prometheus is set and auto discovered.

MongoDB metrics data in Grafana UI

kubectl get deployment
kubectl port-forward deployment/prometheus-grafana 3000

References

Prometheus Monitoring - Steps to monitor third-party apps using Prometheus Exporter | Part 2

Learning – Setup Prometheus Monitoring on Kubernetes

Learning - Setup Prometheus Monitoring on Kubernetes

Prometheus Server

  • Data Retrieval Worker - Retrieval - pull metrics data
  • Time Series Database - Storage - stores metrics data
  • Accepts PromQL queries - HTTP Server - accepts queries

Alertmanager

Prometheus Server => push alerts => Alertmanager => Email, Slack, etc.

Prometheus UI

  • Prometheus Web UI

  • Grafana, etc.

  • Visualize the scraped data in UI

Deployment

How to deploy the different parts in Kubernetes cluster?

  • Creating all configuration YAML files yourself and execute them in right order

    • inefficient
    • lot of effort
  • Using an operator

    • Manager of all Prometheus components
    • Find Prometheus operator
    • Deploy in K8s cluster
  • Using Helm chart to deploy operator

    • maintained by Helm community
    • Helm: initial setup
    • Operator: manage setup

Setup with Helm chart

  • Clean Minikube state
$ kubectl get pod
$ helm install prometheus stable/prometheus-operator
$ kubectl get pod
NAME ...
alertmanager-prometheus-prometheus-oper-alertmanager-0
prometheus-grafana-67...
prometheus-kube-status-metrics-c6...
prometheus-prometheus-node-explorter-jr...
prometheus-prometheus-oper-operator-78...
prometheus-prometheus-prometheus-oper-prometheus-0...

Prometheus Components

kubectl get all

2 Statfulset

Prometheus Server

statefulset.apps/prometheus-prometheus-prometheus-oper-prometheus

Alertmanager

statefulset.apps/alertmanager-prometheus-prometheus-oper-alertmanager

3 Deployments

Prometheus Operator - created Prometheus and Alertmanager StatefulSet

deployment.apps/prometheus-prometheus-oper-operator

Grafana

deployment.apps/prometheus-grafana

Kube State Metrics

deployment.apps/prometheus-kube-state-metrics
  • own Helm chart
  • dependency of this Helm chart
  • scrapes K8s components - K8s infrastructure monitoring

3 StatefulSets

Created by Deployment

replicaset.apps/prometheus-prometheus-oper-operator...
replicaset.apps/prometheus-grafana...
replicaset.apps/prometheus-kube-state-metrics...

1 DaemonSet

  • Node Exporter DaemonSet
daemonset.apps/prometheus-prometheus-node-exporter

DaemonSet runs on every Worker Node

  • connects to Server
  • translates Worker Node metrics to Prometheus metrics - CPU usage, load on server

Completed tasks

  • Monitoring Stack
  • Configuration for your K8s cluster
  • Worker Nodes monitored
  • K8s components monitored

ConfigMaps

kubectl get configmap
  • configurations for different parts
  • managed by operator
  • how to connect to default metrics

Secrets

kubectl get secret
  • for Grafana

  • for Prometheus

  • for Operator

  • certificates

  • username & passwords
    ...

CRDs

kubectl get crd

extension of Kubernetes API

  • custom resource definitions

Describe components

kubectl describe = container/image information

kubectl get statefulset
kubectl describe statefulset prometheus-prometheus-prometheus-oper-prometheus > prom.yaml
kubectl describe statefulset alertmanager-prometheus-prometheus-oper-alertmanager > alert.yaml
kubectl get deployment
kubectl describe deployment prometheus-prometheus-oper-operator > oper.yaml

Stateful oper-prometheus

Containers:

  • prometheus
    • Images: quay.io/prometheus/prometheus:v2.18.1
    • Port: 9090/TCP
    • Mounts: where Prometheus gets its configuration data mounted into Prometheus Pod
    • /etc/prometheus/certs
    • /etc/prometheus/config_out
    • /etc/prometheus/rules/...
    • /prometheus
      They are
    • Configuration file: what endpoints to scrape
    • address of applications: expose /metrics
    • Rules configuration file: alerting rules, etc.

The two sidecar/help container *-reloader, they help reloading, responsible for reloading, when configuration files changes.

  • prometheus-config-reloader

    • Image: quay.io/coreos/prometheus-config-reloader:v0.38.1
    • reloader-url: http://127.0.0.1:9090/-/reload
    • config-file: /etc/prometheus/config/prometheus.yaml.gz
  • rules-configmap-reloader

ConfigMap and Secret (States):

kubectl get configmap
kubectl get secret

In prom.yaml,

  • Args: --config-file=/etc/promtheus/config
  • Mounts:
    • /etc/prometheus/config from config
    • /etc/prometheus/config_out from config_out
  • Volumes: config, it is a secret
kubectl get secret prometheus-prometheus-prometheus-oper-prometheus -o yaml > secret.yaml
apiVersion: v1
data:
  prometheus.yaml.gz: ....

In rules file rules-configmap-reloader

Mounts: /etc/prometheus/rules/prometheus-prometheus-prometheus-oper-prometheus-rulefiles-0 from prometheus-prometheus-prometheus-oper-prometheus-rulefiles-0

Volumes: ConfigMap prometheus-prometheus-prometheus-oper-prometheus-rulefiles-0

kubectl get configmap prometheus-prometheus-prometheus-oper-prometheus-rulefiles-0 -o yaml > config.yaml
  • config.yaml rules file
apiVersion: v1
data:
  default-prometheus-prometheus-oper-alertmanager.rules.yaml
  groups:
    - name: alertmanager.rules
      rules:
      - alert: AlertmanagerConfigInconsistent
...

Stateful alertmanager

Containers:

  • alertmanager

    • Image: quay.io/prometheus/alertmanager:v0.20.0
    • config.file: /etc/alertmanager/config/alertmanager.yaml
  • config-reloader

    • Image: `docker.io/jimmidyson/configmap-reload:v0.3.0

Operator permetheus-operator

Containers:

  • prometheus-operator (orchestrator of monitoring stack)

    • Image: quay.io/coreos/prometheus-operator:v0.38.1
  • tls-proxy

Tasks

  • How to add/adjust alert rules?

  • How to adjust Prometheus configuration?

Access Grafana

$ kubectl get service
...
prometheus-grafana   ClusterIP ...

ClusterIP = Internal Services

$ kubectl get deployment
...
prometheus-grafana
...

$ kubectl get pod
...
prometheus-grafana-67....
...

$ kubectl logs prometheus-grafana-67... -c grafana
...
... user=admin
...
... address=[::]:3000 ...
...

port: 300
default user: admin

$ kubectl port-forward deployment/prometheus-grafana 3000
Forwarding from 127.0.0.1:3000 -> 3000
Forwarding from [::1]:3000 -> 3000

Then the grafana can be accessed via https://localhost:3000

The default admin password is "prom-operator", which can be found in chart: https://github.com/heim/charts/tree/master/stable/prometheus-operator#...

$ kubectl get pod
...
prometheus-kube-state-metrics-c6...
prometheus-prometheus-node-exporter-jr...
...

Prometheus UI

$ kubectl get pod
...
prometheus-prometheus-prometheus-oper-prometheus-0
...

$ kubectl port-forward prometheus-prometheus-prometheus-oper-prometheus-0 9090
Forwarding from 127.0.0.1:9090 -> 9090
Forwarding from [::1]:9090 -> 9090

Then Prometheus UI can be accessed via https://localhost:9090/.

Summarize

  • Deployed Prometheus stack using Helm
    • easy deployment process
  • Overview of what these different components are and do
  • Configure additional metrics endpoint

References

Setup Prometheus Monitoring on Kubernetes using Helm and Prometheus Operator | Part 1

Learning – Prometheus Monitor

Learning - Prometheus Monitor

Monitoring Tool for

  • Highly dynamic container environments

  • Container & Microservices Infrastructure

  • Traditional, bare server

  • constantly monitor all the services

  • alert when crash

  • identify problem before

  • checking memory usage

  • notify administrator

  • Trigger alert at 50%

  • Monitor network loads

Prometheus Server

Does the actual monitoring work

  • Time Series Database
    Storage - stores metrics data (CPU usage, No. of exception)

  • Data Retrieval Worker
    Retrieval - pulls metrics data (Applications, Servers, ...)

  • Accepts PromQL queries
    HTTP Server - accepts queries

  • Prometheus Web UI

  • Grafana

  • etc.

Targets and Metrics

Targets

  • What does Prometheus monitor?

    • Linux/Windows Server
    • Single Application
    • Apache Server
    • Service, like Database
  • Which units are monitored of those targets?

    • CPU Status
    • Memory/Disk Space Usage
    • Requests Count
    • Exceptions Count
    • Request Duration

Metrics

  • Format: Human-readable text-based
  • Metrics entries: TYPE and HELP attributes
    HELP - description of what the metrics is
    TYPE - 3 metrics types

    • Counter - how many times x happened
    • Gauge - what is the current value of x now?
    • Histogram - how long or how big?

Collecting Metrics Data from Targets

Data Retrieval Worker => pull over HTTP => Target (Linux Server, External Service)

  • Pulls from HTTP endpoints
  • hostaddress/metrics
  • must be in correct format

Target Endpoints and Exporters

  • Exposing /metrics endpoints by default
  • Many services need another component

Exporter

  • fetches metrics from target (some service)
  • converts to correct format
  • expose /metrics

List of official exporters ...

Monitor a Linux Server?

  • download a node exporter
  • untar and execute
  • converts metrics of the server
  • exposes /metrics endpoint
  • configure prometheus to scrape this endpoint

Monitoring your own applications

  • How many requests?
  • How many exceptions?
  • How many server resources are used?

Using client libraries you can expose /metrics endpoint

Pull Mechanism

Data Retrieval Worker pulls Targets /metrics

Push system

Amazon Cloud Watch, New Relic - Applications/Servers push to a centralized collection platform

  • high load of network traffic
  • monitoring can become your bottleneck
  • install additional software or tool to push metrics

Pull system - more advantages

  • multiple Premetheus instances can pull metrics data
  • better detection/insight if service is up and running

Pushgateway

What, when target only runs for a short time?

"short-lived job" => push metrics at exit => Pushgateway

Pushgateway <= pull <= Prometheus Server
Prometheus targets <= pull <= Prometheus Server

Configuring Prometheus

How does Prometheus know what to scrape and when?

  • prometheus.yml

    • which targets?
    • at what interval?
  • service discovery
    service discovery <= discover targets <= Prometheus Server

global:
  scrape_interval: 15s
  evaluation_interval: 15s

rule_files:
  # - "first.rules"
  # = "second.rules"

scrape_configs:
  - job_name: prometheus
    static_configs:
      - targets: ['localhost:9090']
  - job_name: node_exporter
    scrape_interval: 1m
    scrape_timeout: 1m
    static_configs:
      - targets: ['localhost:9100]
  • How often Prometheus will scrape its targets
  • Rules for aggregating metric values or creating alerts when condition met
  • What resources Prometheus monitors
    • Prometheus has its own /metrics endpoint

Alert Manager

  • How does Prometheus trigger the alerts?
  • Who receives the alerts?

Prometheus Server => push alerts => Alertmanager => Email, Slack, etc.

Prometheus Data Storage

Where does Prometheus store the data?

  • Local - Disk (HDD/SSD)

  • Remote Storage Systems

  • Custom Time Series Format

    • Can't write prometheus data directly into a relational database

PromQL Query Language

Prometheus Web UI => PromQL => Prometheus Server
Data Visualization Tools => PromQL => Prometheus Server

  • Query target directly
  • Or use more powerful visualization tools - e.g. Grafana

PromQL Query

Query all HTTP status codes except 4xx ones

http_requests_total{status!~"4.."}

Returns the 5-minute rate of the http_requests_total metric for the past 30mins

rate(http_requests_total[5m])[30m:]

Prometheus Characteristics

Pros

  • reliable
  • stand-alone and self-containing
  • works, even if other parts of infrastructure broken
  • no extensive set-up needed
  • less complex

Cons

  • difficult to scale
  • limits monitoring

Workarounds

  • increase Prometheus server capacity
  • limit number of metrics

Prometheus with Docker and Kubernetes

  • fully compatible
  • Prometheus components available as Docker images
  • can easily be deployed in Container Environments like Kubernetes
  • Monitoring of K8s Cluster Node Resources out-of-the box!

References

How Prometheus Monitoring works | Prometheus Architecture explained