Author: Bian Xi

Enable VMmotion in VMware

Enable VMmotion in VMware

Two ESXi servers, for example esx01 and esx02.

CPU

The CPU of both esx01 and esx02 are same family.

Storage

Both esx01 and esx02 are having same shared storage.

Configure

Configure NFS or iSCSI in both ESXi servers.

Verify

Access storage, and check Hosts tab, both ESXi servers should be in the list.

Network

Add VMkernel Network Adapter with vMotion service, can be on an existing standard switch.

References

VMware Tutorial No.45 | VMware vMotion Step by Step |vMotion in VMware 6.7 |vSphere vMotion GOVMLAB

Install VMware vSphere 7.0 on Proxmox

Install VMware vSphere 7.0 on Proxmox

Verify

root@proxmox:~# cat /sys/module/kvm_intel/parameters/nested
Y

Enable

Intel CPU

echo "options kvm-intel nested=Y" > /etc/modprobe.d/kvm-intel.conf

AMD CPU

echo "options kvm-amd nested=1" > /etc/modprobe.d/kvm-amd.conf

Install Module

modprobe -r kvm_intel
modprobe kvm_intel

Note: more info, check https://pve.proxmox.com/wiki/Nested_Virtualization

Install

ISO

Download ISO, such as VMware-VMvisor-Installer-7.0U2a-17867351.x86_64.iso

VM Configure

  • General Tab

    • Name:
  • OS Tab

    • Type: Linux
    • Version: 5.x – 2.6 Kernel
  • System Tab

    • Graphic card: Default
    • SCSI Controller: VMware PVSCSI
    • BIOS: SeaBIOS (OVMF (UEFI) should work too)
    • Machine: q35
  • Hard Disk Tab

    • Bus/Device: SATA
    • Disk size (GiB): 16
  • CPU Tab

    • Cores: 4 (At least 2, 4 will be better if our physical CPU has enough cores)
    • Type: host (or Default (kvm64))
    • Enable NUMA: Check (if possible)
  • Memory Tab

    • Memory (MiB): 4096 (At least 4096, better if assign more)
    • Ballooning Device: Uncheck
  • Network Tab

    • Model: VMware vmxnet3

References

Nested Virtualization
How to Install/use/test VMware vSphere 7.0 (ESXi 7.0) on Proxmox VE 6.3-3 (PVE)

Learning – Ansible 101 – Episode 1 – Introduction to Ansible

Learning - Ansible 101 - Episode 1 - Introduction to Ansible

Introduction to Ansible

Installation

pip3 install ansible
ansible --version

Create inventory file

Create a file called inventory

[example]
107.20.106.183

Run command

ansible -i inventory example -m ping -u centos

Create ansible.cfg file

[defaults]
INVENTORY=inventory

Run command with not inventory option

ansible example -m ping -u centos

Run ad-hoc commnad

ansible example -a "date" -u centos
ansible example -a "free -h" -u centos

In fact, above commands used default module -m command, and the -a option is giving the command arguments.

Install VirtualBox and Vagrant

Then initialize vagrant

vagrant init geerlingguy/centos7

This will create a file called Vagrantfile in current directory.

Vargent VM commands

  • create vm
vagrant up
  • ssh into vm
vagrant ssh
  • show ssh configuration
vagrant ssh-config

This configuration can be used to update ssh configuration

  • shutdown vm
vagrant halt
  • delete vm
vagrant destroy

Create Vagrantfile

Vagrant.configure("2") do |config|
  config.vm.box = "geerlingguy/centos7"

  config.vm.provsion "ansible" do |ansible|
    ansible.playbook = "playbook.yml"
  end
end

Create playbook.yml

---
- name: Set up NTP on all servers.
  hosts: all
  become: yes
  tasks:
    - name: Ensure NTP is installed.
      yum: name=ntp state=present
    - name: Ensure NTP is running.
      service: name=ntpd state=started enabled=yes

The name is optional

    - yum: name=ntp state=present
    - service: name=ntpd state=started enabled=yes

Run provision command

vagrant provision

Idempotence

The command can be run many times without change the result if success before.

But following command in playbook will run every time when triggered playbook.

  - command: yum install -y ntp

To overcome this, change to following

  - shell: |
      if ! rpm -qa | grep -qw ntp; then
        yum install -y ntp
      fi

References

Ansible 101 - Episode 1 - Introduction to Ansible

Learning – Prometheus Exporter

Learning - Prometheus Exporter

Steps to monitor MongoDB metrics

  • Deploy MongoDB App
  • Deploy MongoDB Exporter
  • Deploy ServiceMonitor

Deployment

minikube start --cpus 4 --memory 8192 --vm-driver hyperkit
helm ls
kubectl get pod
kubectl get svc
kubectl port-forward prometheus-kube-prometheus-prometheus 9090
kubectl port-forward prometheus-grafana 80

servicemonitor

ServiceMonitor is a custom Kubernetes component

kubectl get servicemonitor
kubectl get servicemonitor prometheus-kube-prometheus-grafana -oyaml
...
metadata:
  labels:
    release: prometheus

spec:
  endpoints:
    - path: /metrics
      port: service
  selector:
    matchLabels:
      app.kubernetes.io/instance: prometheus
      app.kubernetes.io/name: grafana

CRD configuration

$ kubectl get crd
...
prometheuses.monitoring.coreos.com ...
...
$ kubectl get prometheuses.monitoring.coreos.com -oyaml
...
spec:
  serviceMonitorSelector:
    matchLabels:
      release: prometheus
...

Deploy MongoDB

mongodb-without-exporter.yaml

apiVersion: apps/v1
kind: Deployment
metadata:
  name: mongodb-deployment
  labels:
    app: mongodb
spec:
  replicas: 1
  selector:
    matchLabels:
      app: mongodb
  template:
    metadata:
      labels:
        app: mongodb
    spec:
      containers:
      - name: mongodb
        image: mongo
        ports:
        - containerPort: 27017
---
apiVersion: v1
kind: Service
metadata:
  name: mongodb-service
spec:
  selector:
    app: mongodb
  ports:
    - protocol: TCP
      port: 27017
      targetPort: 27017
kubectl apply -f mongodb-without-exporter.yaml
kubectl get pod

Deploy MongoDB Exporter

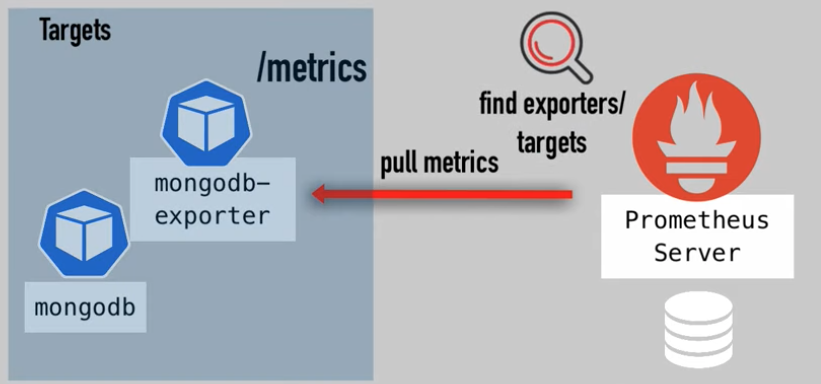
Translator between apps data to Prometheus understandable metrics

Target (MongoDB App) <= fetches metrics <= converts to correct format <= expose /metrics <= Prometheus Server

  • Separate deployment - No need to change config files

MongoDB exporter (mongodb-exporter) can be downloaded from exporter site or dockerhub.

Exporter Site

Exporters can be downloaded from https://prometheus.io/docs/instrumenting/exporters

Nodes exporter - translates metrics of cluster Nodes, exposes /metrics

prometheus-prometheus-node-exporter-8qvwn

Components for exporter

  • Exporter application - exposes /metrics endpoint
  • Service - for connnecting to the exporter
  • ServiceMonitor - to be discovered

Helm chart for exporter

Search for mongodb-exporter helm chart

https://github.com/prometheus-community/helm-charts

Override values using chart parameters

helm show values <chart-name>

Add Helm repo

helm repo add prometheus-community https://prometheus-community.github.io/helm-charts
helm show values prometheus-community/prometheus-mongodb-exporter > values.yaml

Override values in values.yaml

mongodb:
  uri: "mongodb://mongodb-service:27017"

serviceMonitor:
  additionalLabels:
    release: prometheus

with the label Prometheus automatically discovers a new ServiceMonitor in the cluster

$ helm install mongodb-exporter prometheus-community/prometheus-mongodb-exporter -f values.yaml
...
$ helm ls
mongodb-exporter
...
$ kubectl get pod
...
mongodb-exporter-prometheus-mongodb-exporter-75...
...
$ kubectl get svc
...
mongodb-exporter-prometheus-mongodb-exporter
...
$ kubectl get servicemonitor
...
mongodb-exporter-prometheus-mongodb-exporter
...
$ kubectl get servicemonitor mongodb-exporter-prometheus-mongodb-exporter -o yaml
...
metadata:
  labels:
    release: prometheus
...

Check endpoint /metrics

$ kubectl get svc
...
mongodb-exporter-prometheus-mongodb-exporter
...
kubectl port-forward service/mongodb-exporter-prometheus-mongodb-exporter 9216

Access https://127.0.0.1:9216/metrics

The mongodb-exporter is added as targets in prometheus, because the label release: prometheus is set and auto discovered.

MongoDB metrics data in Grafana UI

kubectl get deployment
kubectl port-forward deployment/prometheus-grafana 3000

References

Prometheus Monitoring - Steps to monitor third-party apps using Prometheus Exporter | Part 2

Learning – Setup Prometheus Monitoring on Kubernetes

Learning - Setup Prometheus Monitoring on Kubernetes

Prometheus Server

  • Data Retrieval Worker - Retrieval - pull metrics data
  • Time Series Database - Storage - stores metrics data
  • Accepts PromQL queries - HTTP Server - accepts queries

Alertmanager

Prometheus Server => push alerts => Alertmanager => Email, Slack, etc.

Prometheus UI

  • Prometheus Web UI

  • Grafana, etc.

  • Visualize the scraped data in UI

Deployment

How to deploy the different parts in Kubernetes cluster?

  • Creating all configuration YAML files yourself and execute them in right order

    • inefficient
    • lot of effort
  • Using an operator

    • Manager of all Prometheus components
    • Find Prometheus operator
    • Deploy in K8s cluster
  • Using Helm chart to deploy operator

    • maintained by Helm community
    • Helm: initial setup
    • Operator: manage setup

Setup with Helm chart

  • Clean Minikube state
$ kubectl get pod
$ helm install prometheus stable/prometheus-operator
$ kubectl get pod
NAME ...
alertmanager-prometheus-prometheus-oper-alertmanager-0
prometheus-grafana-67...
prometheus-kube-status-metrics-c6...
prometheus-prometheus-node-explorter-jr...
prometheus-prometheus-oper-operator-78...
prometheus-prometheus-prometheus-oper-prometheus-0...

Prometheus Components

kubectl get all

2 Statfulset

Prometheus Server

statefulset.apps/prometheus-prometheus-prometheus-oper-prometheus

Alertmanager

statefulset.apps/alertmanager-prometheus-prometheus-oper-alertmanager

3 Deployments

Prometheus Operator - created Prometheus and Alertmanager StatefulSet

deployment.apps/prometheus-prometheus-oper-operator

Grafana

deployment.apps/prometheus-grafana

Kube State Metrics

deployment.apps/prometheus-kube-state-metrics
  • own Helm chart
  • dependency of this Helm chart
  • scrapes K8s components - K8s infrastructure monitoring

3 StatefulSets

Created by Deployment

replicaset.apps/prometheus-prometheus-oper-operator...
replicaset.apps/prometheus-grafana...
replicaset.apps/prometheus-kube-state-metrics...

1 DaemonSet

  • Node Exporter DaemonSet
daemonset.apps/prometheus-prometheus-node-exporter

DaemonSet runs on every Worker Node

  • connects to Server
  • translates Worker Node metrics to Prometheus metrics - CPU usage, load on server

Completed tasks

  • Monitoring Stack
  • Configuration for your K8s cluster
  • Worker Nodes monitored
  • K8s components monitored

ConfigMaps

kubectl get configmap
  • configurations for different parts
  • managed by operator
  • how to connect to default metrics

Secrets

kubectl get secret
  • for Grafana

  • for Prometheus

  • for Operator

  • certificates

  • username & passwords
    ...

CRDs

kubectl get crd

extension of Kubernetes API

  • custom resource definitions

Describe components

kubectl describe = container/image information

kubectl get statefulset
kubectl describe statefulset prometheus-prometheus-prometheus-oper-prometheus > prom.yaml
kubectl describe statefulset alertmanager-prometheus-prometheus-oper-alertmanager > alert.yaml
kubectl get deployment
kubectl describe deployment prometheus-prometheus-oper-operator > oper.yaml

Stateful oper-prometheus

Containers:

  • prometheus
    • Images: quay.io/prometheus/prometheus:v2.18.1
    • Port: 9090/TCP
    • Mounts: where Prometheus gets its configuration data mounted into Prometheus Pod
    • /etc/prometheus/certs
    • /etc/prometheus/config_out
    • /etc/prometheus/rules/...
    • /prometheus
      They are
    • Configuration file: what endpoints to scrape
    • address of applications: expose /metrics
    • Rules configuration file: alerting rules, etc.

The two sidecar/help container *-reloader, they help reloading, responsible for reloading, when configuration files changes.

  • prometheus-config-reloader

    • Image: quay.io/coreos/prometheus-config-reloader:v0.38.1
    • reloader-url: http://127.0.0.1:9090/-/reload
    • config-file: /etc/prometheus/config/prometheus.yaml.gz
  • rules-configmap-reloader

ConfigMap and Secret (States):

kubectl get configmap
kubectl get secret

In prom.yaml,

  • Args: --config-file=/etc/promtheus/config
  • Mounts:
    • /etc/prometheus/config from config
    • /etc/prometheus/config_out from config_out
  • Volumes: config, it is a secret
kubectl get secret prometheus-prometheus-prometheus-oper-prometheus -o yaml > secret.yaml
apiVersion: v1
data:
  prometheus.yaml.gz: ....

In rules file rules-configmap-reloader

Mounts: /etc/prometheus/rules/prometheus-prometheus-prometheus-oper-prometheus-rulefiles-0 from prometheus-prometheus-prometheus-oper-prometheus-rulefiles-0

Volumes: ConfigMap prometheus-prometheus-prometheus-oper-prometheus-rulefiles-0

kubectl get configmap prometheus-prometheus-prometheus-oper-prometheus-rulefiles-0 -o yaml > config.yaml
  • config.yaml rules file
apiVersion: v1
data:
  default-prometheus-prometheus-oper-alertmanager.rules.yaml
  groups:
    - name: alertmanager.rules
      rules:
      - alert: AlertmanagerConfigInconsistent
...

Stateful alertmanager

Containers:

  • alertmanager

    • Image: quay.io/prometheus/alertmanager:v0.20.0
    • config.file: /etc/alertmanager/config/alertmanager.yaml
  • config-reloader

    • Image: `docker.io/jimmidyson/configmap-reload:v0.3.0

Operator permetheus-operator

Containers:

  • prometheus-operator (orchestrator of monitoring stack)

    • Image: quay.io/coreos/prometheus-operator:v0.38.1
  • tls-proxy

Tasks

  • How to add/adjust alert rules?

  • How to adjust Prometheus configuration?

Access Grafana

$ kubectl get service
...
prometheus-grafana   ClusterIP ...

ClusterIP = Internal Services

$ kubectl get deployment
...
prometheus-grafana
...

$ kubectl get pod
...
prometheus-grafana-67....
...

$ kubectl logs prometheus-grafana-67... -c grafana
...
... user=admin
...
... address=[::]:3000 ...
...

port: 300
default user: admin

$ kubectl port-forward deployment/prometheus-grafana 3000
Forwarding from 127.0.0.1:3000 -> 3000
Forwarding from [::1]:3000 -> 3000

Then the grafana can be accessed via https://localhost:3000

The default admin password is "prom-operator", which can be found in chart: https://github.com/heim/charts/tree/master/stable/prometheus-operator#...

$ kubectl get pod
...
prometheus-kube-state-metrics-c6...
prometheus-prometheus-node-exporter-jr...
...

Prometheus UI

$ kubectl get pod
...
prometheus-prometheus-prometheus-oper-prometheus-0
...

$ kubectl port-forward prometheus-prometheus-prometheus-oper-prometheus-0 9090
Forwarding from 127.0.0.1:9090 -> 9090
Forwarding from [::1]:9090 -> 9090

Then Prometheus UI can be accessed via https://localhost:9090/.

Summarize

  • Deployed Prometheus stack using Helm
    • easy deployment process
  • Overview of what these different components are and do
  • Configure additional metrics endpoint

References

Setup Prometheus Monitoring on Kubernetes using Helm and Prometheus Operator | Part 1
Learning – Kubernetes Operator

Learning - Kubernetes Operator

Used for Stateful Applications on K8s

Stateless Applications on K8s

Control loop

Observe => Check Differences => Take Action => Observe ...

  • Recreate died pods
  • restart updated pods

Stateful Applications WITHOUT Operator

Data Persistence

  • more "hand-holding" needed

  • throughout whole lifecycle

  • all 3 replicas are different

  • own state and identity

  • order important

  • Process different for each application

  • So, no standard solution

  • manual intervention necessary

  • people, who "operate" these applications

  • can not archive automation, self-healing

Stateful application WITH Operator

To manage stateful application

Replaces human operator with software operator.

  • How to deploy the app?

  • How to create cluster of replicas?

  • How to recover?

  • tasks are automated and reusable

  • One 1 standard automated process

  • more complex/more environments => more benefits

Control loop mechanism

watch for changes

Observe => Check Differences => Take Action => Observe ...

It is custom control loop

make use of CRD's

Custom Resource Definitions

  • custom K8s component (extends K8s API)

Your own custom component

domain/app-specific knowledge

CRD's, StatefulSet, ConfigMap, Service, ...

automates entire lifecycle of the app it operates

Summary

  • Managing complete lifecycle of stateless apps
    No business logic necessary to: create, update, delete
  • K8s can't automate the process natively for stateful apps
    Operators: prometheus-operator, mysql-operator, postgres-operator, elastic-operator

For example: MySQL

  • How to create the mysql cluster
  • How to run it
  • How to synchronize the data
  • How to update

OperatorHub.io

Operator SDK to create own operator

References

Kubernetes Operator simply explained in 10 mins

Learning – Prometheus Monitor

Learning - Prometheus Monitor

Monitoring Tool for

  • Highly dynamic container environments

  • Container & Microservices Infrastructure

  • Traditional, bare server

  • constantly monitor all the services

  • alert when crash

  • identify problem before

  • checking memory usage

  • notify administrator

  • Trigger alert at 50%

  • Monitor network loads

Prometheus Server

Does the actual monitoring work

  • Time Series Database
    Storage - stores metrics data (CPU usage, No. of exception)

  • Data Retrieval Worker
    Retrieval - pulls metrics data (Applications, Servers, ...)

  • Accepts PromQL queries
    HTTP Server - accepts queries

  • Prometheus Web UI

  • Grafana

  • etc.

Targets and Metrics

Targets

  • What does Prometheus monitor?

    • Linux/Windows Server
    • Single Application
    • Apache Server
    • Service, like Database
  • Which units are monitored of those targets?

    • CPU Status
    • Memory/Disk Space Usage
    • Requests Count
    • Exceptions Count
    • Request Duration

Metrics

  • Format: Human-readable text-based
  • Metrics entries: TYPE and HELP attributes
    HELP - description of what the metrics is
    TYPE - 3 metrics types

    • Counter - how many times x happened
    • Gauge - what is the current value of x now?
    • Histogram - how long or how big?

Collecting Metrics Data from Targets

Data Retrieval Worker => pull over HTTP => Target (Linux Server, External Service)

  • Pulls from HTTP endpoints
  • hostaddress/metrics
  • must be in correct format

Target Endpoints and Exporters

  • Exposing /metrics endpoints by default
  • Many services need another component

Exporter

  • fetches metrics from target (some service)
  • converts to correct format
  • expose /metrics

List of official exporters ...

Monitor a Linux Server?

  • download a node exporter
  • untar and execute
  • converts metrics of the server
  • exposes /metrics endpoint
  • configure prometheus to scrape this endpoint

Monitoring your own applications

  • How many requests?
  • How many exceptions?
  • How many server resources are used?

Using client libraries you can expose /metrics endpoint

Pull Mechanism

Data Retrieval Worker pulls Targets /metrics

Push system

Amazon Cloud Watch, New Relic - Applications/Servers push to a centralized collection platform

  • high load of network traffic
  • monitoring can become your bottleneck
  • install additional software or tool to push metrics

Pull system - more advantages

  • multiple Premetheus instances can pull metrics data
  • better detection/insight if service is up and running

Pushgateway

What, when target only runs for a short time?

"short-lived job" => push metrics at exit => Pushgateway

Pushgateway <= pull <= Prometheus Server
Prometheus targets <= pull <= Prometheus Server

Configuring Prometheus

How does Prometheus know what to scrape and when?

  • prometheus.yml

    • which targets?
    • at what interval?
  • service discovery
    service discovery <= discover targets <= Prometheus Server

global:
  scrape_interval: 15s
  evaluation_interval: 15s

rule_files:
  # - "first.rules"
  # = "second.rules"

scrape_configs:
  - job_name: prometheus
    static_configs:
      - targets: ['localhost:9090']
  - job_name: node_exporter
    scrape_interval: 1m
    scrape_timeout: 1m
    static_configs:
      - targets: ['localhost:9100]
  • How often Prometheus will scrape its targets
  • Rules for aggregating metric values or creating alerts when condition met
  • What resources Prometheus monitors
    • Prometheus has its own /metrics endpoint

Alert Manager

  • How does Prometheus trigger the alerts?
  • Who receives the alerts?

Prometheus Server => push alerts => Alertmanager => Email, Slack, etc.

Prometheus Data Storage

Where does Prometheus store the data?

  • Local - Disk (HDD/SSD)

  • Remote Storage Systems

  • Custom Time Series Format

    • Can't write prometheus data directly into a relational database

PromQL Query Language

Prometheus Web UI => PromQL => Prometheus Server
Data Visualization Tools => PromQL => Prometheus Server

  • Query target directly
  • Or use more powerful visualization tools - e.g. Grafana

PromQL Query

Query all HTTP status codes except 4xx ones

http_requests_total{status!~"4.."}

Returns the 5-minute rate of the http_requests_total metric for the past 30mins

rate(http_requests_total[5m])[30m:]

Prometheus Characteristics

Pros

  • reliable
  • stand-alone and self-containing
  • works, even if other parts of infrastructure broken
  • no extensive set-up needed
  • less complex

Cons

  • difficult to scale
  • limits monitoring

Workarounds

  • increase Prometheus server capacity
  • limit number of metrics

Prometheus with Docker and Kubernetes

  • fully compatible
  • Prometheus components available as Docker images
  • can easily be deployed in Container Environments like Kubernetes
  • Monitoring of K8s Cluster Node Resources out-of-the box!

References

How Prometheus Monitoring works | Prometheus Architecture explained