Uncompress .xz
file
unxz < file.tar.xz > file.tar
.xz
fileunxz < file.tar.xz > file.tar
Table of Contents
root@proxmox:~# cat /sys/module/kvm_intel/parameters/nested
Y
Intel CPU
echo "options kvm-intel nested=Y" > /etc/modprobe.d/kvm-intel.conf
AMD CPU
echo "options kvm-amd nested=1" > /etc/modprobe.d/kvm-amd.conf
Install Module
modprobe -r kvm_intel
modprobe kvm_intel
Note: more info, check https://pve.proxmox.com/wiki/Nested_Virtualization
Download ISO, such as VMware-VMvisor-Installer-7.0U2a-17867351.x86_64.iso
General Tab
OS Tab
System Tab
Hard Disk Tab
CPU Tab
Memory Tab
Network Tab
Nested Virtualization
How to Install/use/test VMware vSphere 7.0 (ESXi 7.0) on Proxmox VE 6.3-3 (PVE)
When press FN-F11 key to VNC browser window of Proxmox VM console, it only shows the desktop.
To send the F11 key to ESXi installation screen, press FN-CMD-F11 instead.
Table of Contents
minikube start --cpus 4 --memory 8192 --vm-driver hyperkit
helm ls
kubectl get pod
kubectl get svc
kubectl port-forward prometheus-kube-prometheus-prometheus 9090
kubectl port-forward prometheus-grafana 80
ServiceMonitor is a custom Kubernetes component
kubectl get servicemonitor
kubectl get servicemonitor prometheus-kube-prometheus-grafana -oyaml
...
metadata:
labels:
release: prometheus
spec:
endpoints:
- path: /metrics
port: service
selector:
matchLabels:
app.kubernetes.io/instance: prometheus
app.kubernetes.io/name: grafana
CRD configuration
$ kubectl get crd
...
prometheuses.monitoring.coreos.com ...
...
$ kubectl get prometheuses.monitoring.coreos.com -oyaml
...
spec:
serviceMonitorSelector:
matchLabels:
release: prometheus
...
mongodb-without-exporter.yaml
apiVersion: apps/v1
kind: Deployment
metadata:
name: mongodb-deployment
labels:
app: mongodb
spec:
replicas: 1
selector:
matchLabels:
app: mongodb
template:
metadata:
labels:
app: mongodb
spec:
containers:
- name: mongodb
image: mongo
ports:
- containerPort: 27017
---
apiVersion: v1
kind: Service
metadata:
name: mongodb-service
spec:
selector:
app: mongodb
ports:
- protocol: TCP
port: 27017
targetPort: 27017
kubectl apply -f mongodb-without-exporter.yaml
kubectl get pod
Translator between apps data to Prometheus understandable metrics
Target (MongoDB App) <= fetches metrics <= converts to correct format <= expose /metrics <= Prometheus Server
MongoDB exporter (mongodb-exporter) can be downloaded from exporter site or dockerhub.
Exporters can be downloaded from https://prometheus.io/docs/instrumenting/exporters
Nodes exporter - translates metrics of cluster Nodes, exposes /metrics
prometheus-prometheus-node-exporter-8qvwn
/metrics
endpointhttps://github.com/prometheus-community/helm-charts
helm show values <chart-name>
helm repo add prometheus-community https://prometheus-community.github.io/helm-charts
helm show values prometheus-community/prometheus-mongodb-exporter > values.yaml
Override values in values.yaml
mongodb:
uri: "mongodb://mongodb-service:27017"
serviceMonitor:
additionalLabels:
release: prometheus
with the label Prometheus automatically discovers a new ServiceMonitor in the cluster
$ helm install mongodb-exporter prometheus-community/prometheus-mongodb-exporter -f values.yaml
...
$ helm ls
mongodb-exporter
...
$ kubectl get pod
...
mongodb-exporter-prometheus-mongodb-exporter-75...
...
$ kubectl get svc
...
mongodb-exporter-prometheus-mongodb-exporter
...
$ kubectl get servicemonitor
...
mongodb-exporter-prometheus-mongodb-exporter
...
$ kubectl get servicemonitor mongodb-exporter-prometheus-mongodb-exporter -o yaml
...
metadata:
labels:
release: prometheus
...
/metrics
$ kubectl get svc
...
mongodb-exporter-prometheus-mongodb-exporter
...
kubectl port-forward service/mongodb-exporter-prometheus-mongodb-exporter 9216
Access https://127.0.0.1:9216/metrics
The mongodb-exporter is added as targets in prometheus, because the label release: prometheus
is set and auto discovered.
kubectl get deployment
kubectl port-forward deployment/prometheus-grafana 3000
Prometheus Monitoring - Steps to monitor third-party apps using Prometheus Exporter | Part 2
Table of Contents
Prometheus Server => push alerts => Alertmanager => Email, Slack, etc.
Prometheus Web UI
Grafana, etc.
Visualize the scraped data in UI
How to deploy the different parts in Kubernetes cluster?
Creating all configuration YAML files yourself and execute them in right order
Using an operator
Using Helm chart to deploy operator
$ kubectl get pod
$ helm install prometheus stable/prometheus-operator
$ kubectl get pod
NAME ...
alertmanager-prometheus-prometheus-oper-alertmanager-0
prometheus-grafana-67...
prometheus-kube-status-metrics-c6...
prometheus-prometheus-node-explorter-jr...
prometheus-prometheus-oper-operator-78...
prometheus-prometheus-prometheus-oper-prometheus-0...
kubectl get all
Prometheus Server
statefulset.apps/prometheus-prometheus-prometheus-oper-prometheus
Alertmanager
statefulset.apps/alertmanager-prometheus-prometheus-oper-alertmanager
Prometheus Operator - created Prometheus and Alertmanager StatefulSet
deployment.apps/prometheus-prometheus-oper-operator
Grafana
deployment.apps/prometheus-grafana
Kube State Metrics
deployment.apps/prometheus-kube-state-metrics
Created by Deployment
replicaset.apps/prometheus-prometheus-oper-operator...
replicaset.apps/prometheus-grafana...
replicaset.apps/prometheus-kube-state-metrics...
daemonset.apps/prometheus-prometheus-node-exporter
DaemonSet runs on every Worker Node
kubectl get configmap
kubectl get secret
for Grafana
for Prometheus
for Operator
certificates
username & passwords
...
kubectl get crd
extension of Kubernetes API
kubectl describe = container/image information
kubectl get statefulset
kubectl describe statefulset prometheus-prometheus-prometheus-oper-prometheus > prom.yaml
kubectl describe statefulset alertmanager-prometheus-prometheus-oper-alertmanager > alert.yaml
kubectl get deployment
kubectl describe deployment prometheus-prometheus-oper-operator > oper.yaml
Containers:
/etc/prometheus/certs
/etc/prometheus/config_out
/etc/prometheus/rules/...
/prometheus
/metrics
The two sidecar/help container *-reloader
, they help reloading, responsible for reloading, when configuration files changes.
prometheus-config-reloader
rules-configmap-reloader
ConfigMap and Secret (States):
kubectl get configmap
kubectl get secret
In prom.yaml
,
--config-file=/etc/promtheus/config
/etc/prometheus/config from config
/etc/prometheus/config_out from config_out
config
, it is a secretkubectl get secret prometheus-prometheus-prometheus-oper-prometheus -o yaml > secret.yaml
apiVersion: v1
data:
prometheus.yaml.gz: ....
In rules file rules-configmap-reloader
Mounts: /etc/prometheus/rules/prometheus-prometheus-prometheus-oper-prometheus-rulefiles-0 from prometheus-prometheus-prometheus-oper-prometheus-rulefiles-0
Volumes: ConfigMap prometheus-prometheus-prometheus-oper-prometheus-rulefiles-0
kubectl get configmap prometheus-prometheus-prometheus-oper-prometheus-rulefiles-0 -o yaml > config.yaml
config.yaml
rules fileapiVersion: v1
data:
default-prometheus-prometheus-oper-alertmanager.rules.yaml
groups:
- name: alertmanager.rules
rules:
- alert: AlertmanagerConfigInconsistent
...
Containers:
alertmanager
config.file
: /etc/alertmanager/config/alertmanager.yaml
config-reloader
Containers:
prometheus-operator (orchestrator of monitoring stack)
tls-proxy
How to add/adjust alert rules?
How to adjust Prometheus configuration?
$ kubectl get service
...
prometheus-grafana ClusterIP ...
ClusterIP = Internal Services
$ kubectl get deployment
...
prometheus-grafana
...
$ kubectl get pod
...
prometheus-grafana-67....
...
$ kubectl logs prometheus-grafana-67... -c grafana
...
... user=admin
...
... address=[::]:3000 ...
...
port: 300
default user: admin
$ kubectl port-forward deployment/prometheus-grafana 3000
Forwarding from 127.0.0.1:3000 -> 3000
Forwarding from [::1]:3000 -> 3000
Then the grafana can be accessed via https://localhost:3000
The default admin password is "prom-operator", which can be found in chart: https://github.com/heim/charts/tree/master/stable/prometheus-operator#...
$ kubectl get pod
...
prometheus-kube-state-metrics-c6...
prometheus-prometheus-node-exporter-jr...
...
$ kubectl get pod
...
prometheus-prometheus-prometheus-oper-prometheus-0
...
$ kubectl port-forward prometheus-prometheus-prometheus-oper-prometheus-0 9090
Forwarding from 127.0.0.1:9090 -> 9090
Forwarding from [::1]:9090 -> 9090
Then Prometheus UI can be accessed via https://localhost:9090/
.
Setup Prometheus Monitoring on Kubernetes
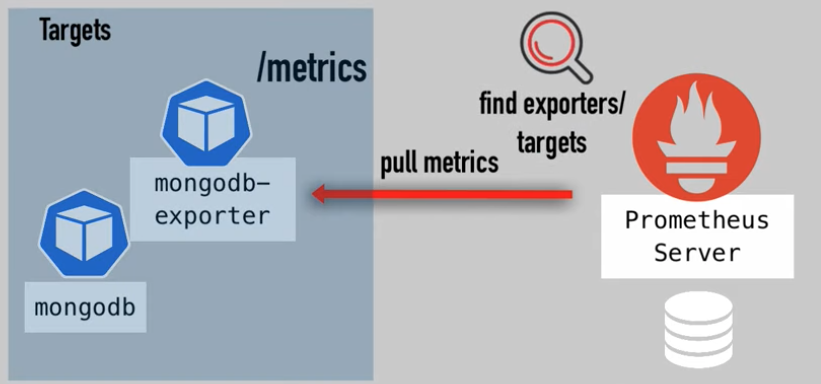
 using Helm and Prometheus Operator | Part 1
Table of Contents
Used for Stateful Applications on K8s
Control loop
Observe => Check Differences => Take Action => Observe ...
Data Persistence
more "hand-holding" needed
throughout whole lifecycle
all 3 replicas are different
own state and identity
order important
Process different for each application
So, no standard solution
manual intervention necessary
people, who "operate" these applications
can not archive automation, self-healing
To manage stateful application
Replaces human operator with software operator.
How to deploy the app?
How to create cluster of replicas?
How to recover?
tasks are automated and reusable
One 1 standard automated process
more complex/more environments => more benefits
watch for changes
Observe => Check Differences => Take Action => Observe ...
It is custom control loop
Custom Resource Definitions
Your own custom component
CRD's, StatefulSet, ConfigMap, Service, ...
automates entire lifecycle of the app it operates
For example: MySQL
OperatorHub.io
Operator SDK to create own operator
Table of Contents
Just to refresh my Docker knowledge.
docker logs -f --tail 100 nginx
docker network create mongo-network
docker-compose -f docker-compose.yaml up
docker-compose -f docker-compose.yaml down
FROM nginx:1.10.2-alpine
MAINTAINER my@example.com
ENV
RUN
COPY ./nginx.conf /etc/nginx/nginx.conf
CMD
docker build -t my-app:1.0 .
Fully-managed Docker container registry
docker pull mongo:4.2
same as
docker pull docker.io/library/mongo:4.2
docker tag my-app:latest <reg>/my-app:latest
docker push <reg>/my-app:latest
c:\programData\docker\volumes
/var/lib/docker/volumes
In Mac
# screen ~/Library/Containers/com.docker.docker/Data/com.docker.amd64-linux/tty
# ls /var/lib/docker/volumes
Table of Contents
Front design, https://getbootstrap.com, includes CCS, Components, etc.
Getting start has examples, sign in page can be downloaded as well.
Bootstrap CDN - Content delivery network online
Include css into the head tag of the page
<link rel="stylesheet" href="https://maxcdn.bootstrapcdn.com/bootstrap/3.3.5/css/bootstrap.min.css">
Include the java script just before the closing of body tag
<script src="https://maxcdn.bootstrapcdn.com/bootstrap/3.3.5/js/bootstrap.min.js"></script>
Create app/views/login.htm
Create app/models/User.php
Create app/controllers/UserController.php
Create app/css/signin.css
or a static folder for this
Copy bootstrap login sample html to login.htm
Copy bootstrap login sample css to signin.css
Clean up login.htm
Create UserController.php
class UserController extends Controller {
function render() {
$template = new Template;
echo $template->render('login.htm');
}
}
routes.ini
Add
GET /login=UserController->render
The login page built as https://localhost:8088/login
Remove Remember me and change variable names, and name attribute for input fields
routes.ini
Add following line
POST /authenticate=UserController->authenticate
login.htm
<form class="form-signin" method="POST" action="/authenticate">
Create table user
with id, username, password.
$ php -a
echo password_hash('f3password', PASSWORD_DEFAULT);
$2y......
Add an user with username=f3user and the password=$2y......
Create User.php
by modifying Messages.php
class User extends DB\SQL\Mapper {
public function __construct(DB\SQL $db) {
parent::__construct($db, 'user');
}
public function getByName() {
$this->load(array('username=?', $name));
}
public function all() {
$this->load();
return $this->query;
}
...
*Note: Function all()
can be used to assign to a variable, getByName()
is return the object itself.
UserController
classfunction authenticate() {
$username = $this->f3->get('POST.username');
$password = $this->f3->get('POST.password');
$user = new User($this->db);
$user->getByName($username);
if ($user->dry()) {
// echo 'User does not exist.';
$this->f3->reroute('/login')
}
if (password_verify($password, $user->password)) {
// echo 'password OK';
$this->f3->reroute('/');
}
else {
// echo 'password NOT OK';
$this->f3->reroute('/login')
}
}
Note: dry() is db function.
Look for Fat-Free Session Handler
Add following line in config.ini
CACHE=true
...
new Session();
$f3->run();
authenticate
in UseController
classif (password_verify($password, $user->password)) {
$this->f3->set('SESSION.user', $user->usename)'
$this->f3->reroute('/');
}
beforeroute
in Controller
classfunction beforeroute() {
if ($this->f3->get('SESSION.user') === null) {
$this->f3->reroute('/login');
exit;
}
}
UserController
classBecause this update is in Controller
class, so every page will go thru the verification. To ignore this behavior for login.htm
, update UserController
class. Adding following empty function to overwrite beforeroute()
function beforeroute() {
}
Adding Bootstrap and User Authentication to Fatfree PHP MVC Project
Go to https://getbootstrap.com/getting-started/#examples, select Dashboard.
Copy dashboard.htm
to app/views/dashboard.htm
Copy dashboard.css
into app/css/dashboard.css
Create app/views/header.htm
dashboard.htm
into header.htm
bootstrap.min.css
to CBN versiondashboard.css
Create app/views/layout.htm
<include href="header.htm" />
<include href="{{ @view }}" />
MainController
class<?php
class MainController extends Controller {
function render() {
$this->f3->set('view', 'dashoboard.htm');
$template = new Template;
echo $template->render('layout.htm');
}
}
nav.htm
Move the body contents before Dashboard div into file nav.htm
<body>
...
...
<ui class="nav nav-sidebar">
...
</ui>
</div>
This is the summary list of my posts during learning.
Learning - Fat-Free PHP Framework
Learning - Fat-Free PHP Framework (Bootstrap & Authentication)
Learning - Fat-Free PHP Framework (Template Hierarchy)
Learning - Fat-Free PHP Framework (Data Sets)